Abstract According to the latest statistics from the customs, China's polysilicon imports in October 2015 were 7,504 tons, down 29.2% from the previous month, mainly benefiting from the smooth implementation of the “No. 58 Document”, and the import volume of processing trade was controlled...
According to the latest statistics from the customs, China's polysilicon imports in October 2015 were 7,504 tons, down 29.2% from the previous month, mainly benefiting from the smooth implementation of Document No. 58 and the control of import of processing trade. On the other hand, due to October. The import volume from South Korea was significantly reduced to 3,084 tons, a decrease of 37.5% from the previous month, which was related to the suspension of production and maintenance of individual polysilicon enterprises in South Korea in the third quarter. Although the import volume has decreased slightly, the domestic polysilicon supply is sufficient. The latest statistics in China are still above 15,000 tons in November, which can maintain sufficient supply of raw materials in the case of increased downstream demand for photovoltaics, resulting in a weak market for polysilicon. The flash of the photovoltaic cell module market is in stark contrast.
Imports from the United States decreased by 7.3% in October, but compared with the historical minimum imports in August, there was a 169% increase, which was 533 tons. Imports from the United States rose again in the past two months, mainly due to August 31. The orders for some processing trade manuals that have been closed have been re-executed after special approval. Therefore, the import of processing trade can also be seen in the customs data. In October, the import volume from the United States in processing trade was 219 tons, accounting for the total imports from the United States in the month. 41.1%. In October, the total amount of imported polysilicon that was not taxed in total was 1,841 tons, accounting for 24.5% of the total import volume of the month. This type of duty-free import method is mainly up to 1,708 tons for the “bonded area warehousing” approach. Caused the attention of the regulatory authorities.

In addition, it is particularly noteworthy that Taiwan is not known as a polysilicon producer, but in the customs data, Taiwan appears as a place of origin, one may be a forged certificate of origin, and the other is a re-export of silicon from the United States that requires a high tariff. Taiwan, processed into an evasive behavior of ingots exported to mainland China. In October, Taiwan’s re-exports of domestic polysilicon reached 1,071 tons, accounting for 14.3% of the total imports of the month. It has surpassed the United States for the fourth consecutive month to become China’s third-largest import region, and Taiwan’s imports of polysilicon from the United States were 1,099 tons that month. Almost full transfer into mainland China shows that the evasion of US polysilicon through Taiwan's re-export has become increasingly rampant.
According to data from country imports in October, 7146 tons of polysilicon were imported from South Korea, the United States, Germany and Taiwan, accounting for 95.2% of the total imports, of which 3,084 tons were imported from South Korea, accounting for 41.1% of total imports. %; imports from the United States were 533 tons, accounting for 7.1% of total imports; imports from Germany were 2459 tons, accounting for 32.8% of total imports; imports from Taiwan were 1071 tons, accounting for 14.3% of total imports; Imports from other regions were 357 tons, accounting for 4.8% of the total.
It is worth noting the following three points:
In October, the amount of polysilicon imported from Taiwan was 1,710 tons, accounting for 14.3% of the total imports in the month. From January to October, the total imports from Taiwan were 8,254 tons, an increase of 14.2% year-on-year. Before June 2015, the proportion of imports from Taiwan was basically maintained at around 6-8%. Since July, the proportion of Taiwan’s imports has increased day by day, until it reached a record high of 14.3% in October, and has surpassed the United States for four consecutive months. China's third largest import region. It is not surprising that the actual transcendence of the United States is apparently due to the fact that polysilicon, which was originally imported directly into the United States, is now blocked from entering the Chinese market, bypassing Taiwan, and entering the country after processing continues to hit the market. In October, for example, the total import volume from the United States and Taiwan was 1,604 tons, which is almost the same as the number of imports from the United States before the processing trade was unblocked. Therefore, it is inferred that polysilicon imported from Taiwan is imported from the United States and processed. After casting intogots, re-export to China. The reversal of Taiwan’s anti-circumvention phenomenon has become increasingly significant, seriously weakening the effectiveness of “double-reverse” and “Document No. 58”, and continues to cause impact on domestic polysilicon enterprises. Therefore, blocking the loopholes in Taiwan’s re-export is an urgent top priority.
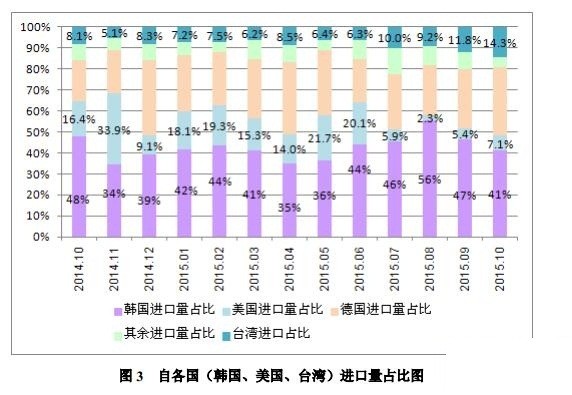
Second, the amount of polysilicon imported from South Korea in October was 3084 tons, accounting for 41.1% of the total imports in the month, a decrease of 37.5% from the previous month. The decrease in imports from South Korea in October was mainly affected by the overhaul of South Korea's HKS in the third quarter. From January to October, the cumulative import of polysilicon from South Korea was 42,125 tons, accounting for 42.7% of the total imports. The import volume increased by 49.7% year-on-year. South Korea's major exporters OCI and South Korea's Silicon Industry (Hankook Silicon) have a tax rate of only 2.4% and 2.8%. Anti-dumping duties have no effect at all, so South Korea surpassed the US and Germany in May 2014 and became the largest. The source of imports has been in the first place for more than one year. From January to October, imports of 14323 tons of polysilicon from South Korea through processing trade, accounting for 34.8% of the total imports from South Korea, although the proportion is not the largest, but because its total import volume ranks first, the total import volume from South Korea processing trade is also the same Ranked first, compared to the next German processing trade volume is still 0.5% higher. It can be seen that imports from South Korea, both in terms of total volume and processing trade, have strongly impacted the domestic polysilicon market. Therefore, reviewing Korean dumping should be put on the agenda in time.

Third, according to the trade method, in October 2015 China's processing trade and other methods imported 1,841 tons, accounting for 24.5%. From January to October, the cumulative import of 45,960 tons by processing trade, accounting for 47.7% of the total total import volume. It is specific to the country: In October, 335 tons of polysilicon was imported from South Korea in processing trade, accounting for 10.9% of total imports from South Korea. From January to October, imports from South Korea were 14,323 tons, which accounted for cumulative imports. 34.8%, even if the tax rate of 2.4% should be circumvented by processing trade; in October, 219 tons of polysilicon was imported from the United States by processing trade, accounting for 41.1% of the total imports from the United States. In October, the processing trade volume rebounded. This is due to the special approval of the uncompleted manual orders before August 31. From January to October, the cumulative import of 11352 tons from the United States in processing trade, accounting for 89.1%; in October, Germany imported 1,246 tons of polysilicon by processing trade, accounting for 50.7% of the total imports from Germany, is the proportion of processing trade in October The highest country, mainly due to the delay in the release of its import volume in bonded warehouses. In October, the volume of warehousing and re-exports in the bonded area was 1,708 tons. From January to October, the total import of 14255 tons from Germany was processed, which accounted for 53.5 tons. %.
The specific statistics by country are as follows:

Korea:
In October 2015, the amount of polysilicon imported from South Korea was 3,084 tons, a significant decrease of 37.5% from the previous month. In October, the unit
Price of imports reached a record low, dropping to 15.14 US dollars / kg, a decrease of 1.04%. In the first ten months of 2015, the cumulative amount of polysilicon imported from South Korea was 42,125 tons, an increase of 49.7% year-on-year; the average import price in January-October was US$16.80/kg, a year-on-year decrease of 20.2%.
United States:
In October 2015, the amount of polysilicon imported from the United States was 533 tons, a decrease of 7.3% from the previous month. In October, the unit price of imports rose sharply to 23.26 US dollars / kg, an increase of 21.0%.
In the first ten months of 2015, the cumulative amount of polysilicon imported from the United States was 12,734 tons, down 21.7% year-on-year; the average import price in January-October was US$17.56/kg, a year-on-year decrease of 8.6%.
Germany:
In October 2015, the amount of polysilicon imported from Germany was 2,459 tons, a decrease of 17.0% from the previous month. In October, the unit price of imports fell to 18.48 US dollars/kg, a decrease of 3.04% from the previous month.
In the first ten months of 2015, the cumulative amount of polysilicon imported from Germany was 26,635 tons, an increase of 8.7% year-on-year; the average import price in January-October was US$20.46/kg, a year-on-year decrease of 13.4%.
According to customs statistics, in October 2015, China's polysilicon exports were 1,207 tons, an increase of 77.5% from the previous month. In the first ten months of this year, the total exports were 6,432 tons, an increase of 229%.
Schedule 1: